As you might know if you got to this page, I am quite an active member on the Unreal Slackers discord. Over time I noticed a lot of the same issues kept popping up, so I decided to write something down to save myself some typing time (hopefully).
Table of Contents
- Learning Resources
- Hot Reload
- Generated Body
- Error List
- Access Violation
- Unresolved External
- Undefined Type
- Garbage Collector Crash
- Tick not being called
- Basic Debugging
- Editor Symbols
- Unity Build
Learning Resources
If you are just getting started with C++ and don’t really have an idea what you are doing, it is probably a good idea to learn the basics of C++ first before diving into unreal code.
If you are looking for a free resource about basic C++ check out learncpp.com.
For a more complete view, it might be more interesting to check out a few books, you can find a great listing of C++ books going from beginner to advanced here.
Some of these books can be found on Google Books, other can be bought, found in your local library, or obtained in alternative ways.
Once you are making the step to go over to unreal, it might be a good idea to play around with blueprints a bit to get more familiar with the API of the engine.
If you feel you are ready to take on C++ in Unreal Engine be sure to check out this starter course.
Contrary to what this title suggests, this is useful for learning the unreal way of doing C++, regardless if you’re coming from blueprints or not.
Another interesting source to check out is the official documentation page for Introduction to C++ Programming in UE4.
Hot Reload
If you are compiling your code, but your blueprint or in game behaviour does not seem to be updated to your newest code, this might be because of hot reloading.
If your actor hierarchy seems to randomly be completely wrong/broken, this might be because of hot reload.
Basically hot reloading can corrupt your whole project if you’re not careful.
Hot reloading occurs when you are compiling with the editor open.
This could be triggered by pressing the compile button in the editor, or even by compiling in your IDE while the editor is open in the background.
Hot reloading is known to corrupt blueprints, and if you save the blueprints after hot reloading, you save the corruption with it, potentially breaking your entire blueprint.
If this has happened to you, there’s no proper way to salvage the blueprint. You will have to delete it and create a new one from scratch.
To avoid hot reloading, always close the editor before compiling (or just launch with f5 every time), or enable live coding.
In short: Hot Reload Sucks.
NOTE: Live Coding is not the same thing as hot reloading, if you have Live Coding enabled, Hot Reload is automatically disabled.
Generated Body
Some (outdated) tutorials will show you how to declare a class and use GENERATED_UCLASS_BODY() or GENERATED_USTRUCT_BODY(), these macros are deprecated and should no longer be used, instead prefer GENERATED_BODY(). It does pretty much the same as the 2 other macros. The main slight difference being that the old macros added a public: at the end and the new one doesn’t, so you’ll have to mark your functions/variables inside a public block yourself (which does make more sense).
UCLASS()
class COOLGAME_API UMyClass : public UObject
{
	GENERATED_BODY()

public:
    //...
}
Error List
When writing code, there’s a good chance that your code will not compile first try. You might be seeing a bunch of errors and be thinking “this all seems irrelevant to my code and/or junk information”. There’s a good chance you might be looking at the Error List of Visual Studio. The information in this window is quite unreliable and useless when working with unreal. Because all kinds of intellisense errors and other irrelevant junk will show up in here.
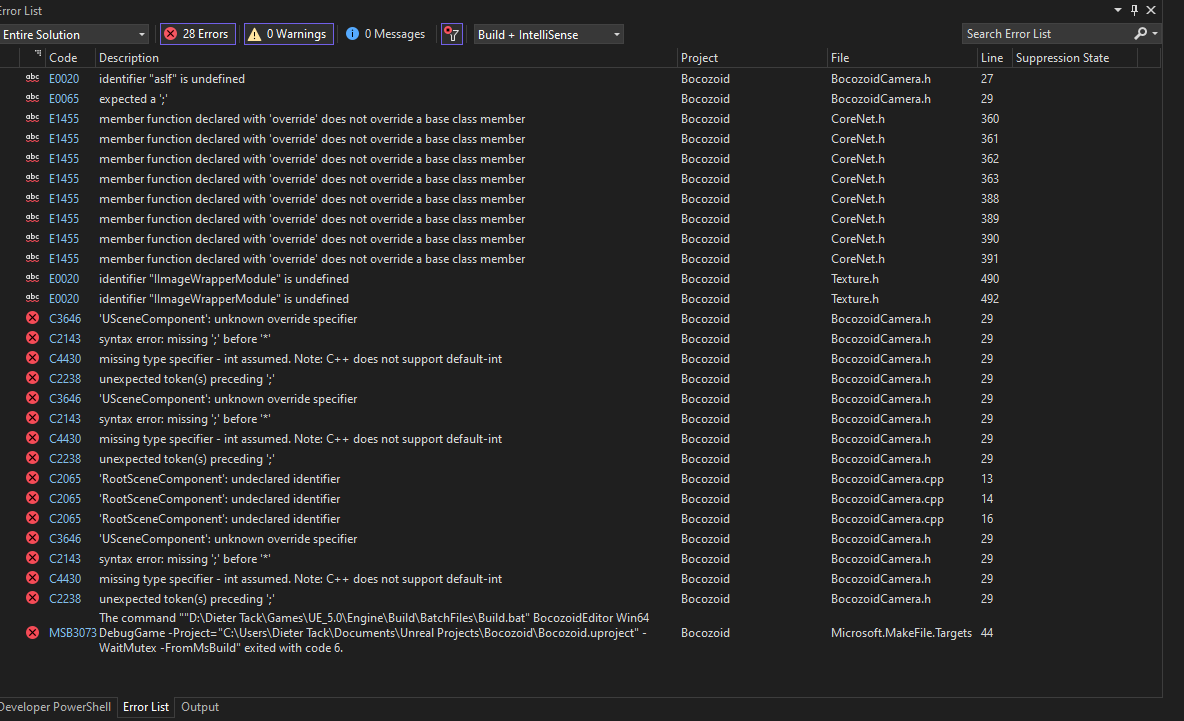
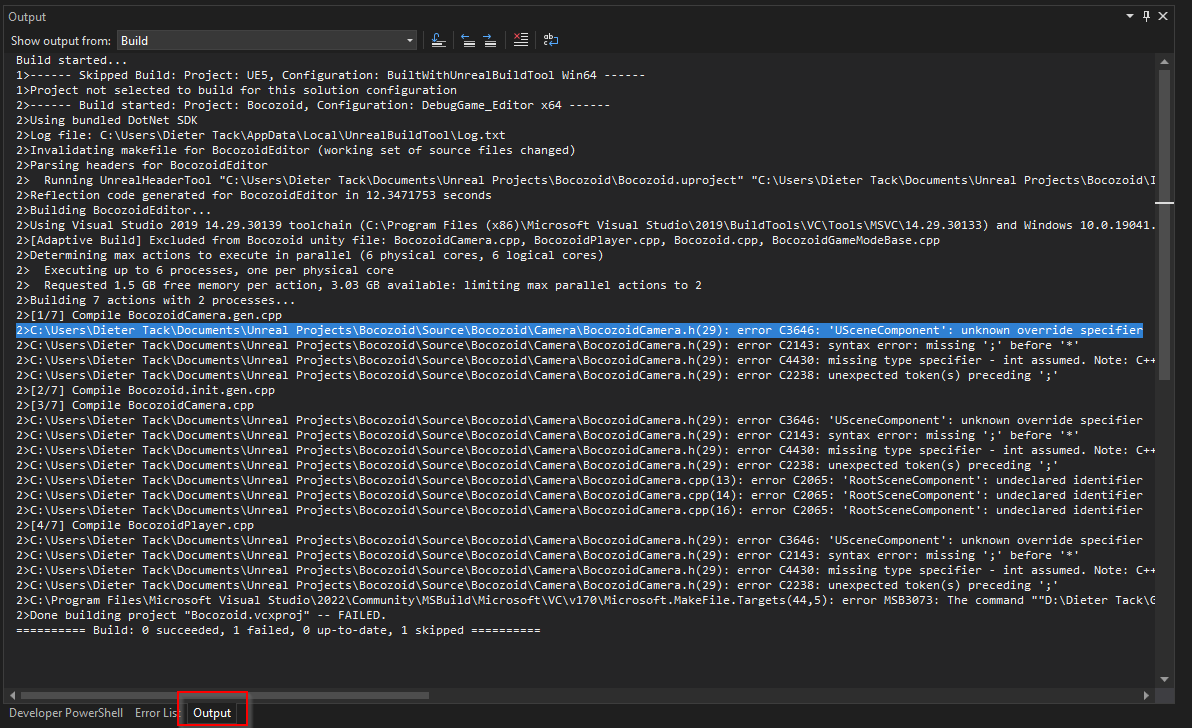
Instead of basing your fixing efforts on this useless information, you might want to use the Output window instead. This accurately only shows relevant compiler errors (compiler errors are the only kind of errors you should care about by the way) together with the probable file and line number of the error. This window can normally be found on the same menu bar at the bottom of Visual Studio, or by going through the top menu View > Output, or by pressing Alt + 2
Even the official documentation of unreal’s visual studio setup recommends turning off the error list, see documentation here.
Access Violation
At some point your program might crash and give you an error like the following:
Exception thrown: read access violation.
'X' was 0x00000018.
As the error says, this indicates an access violation. Which means that you are trying to access memory that is unreadable/invalid.
The most common case for this is that your program is trying to access a nullptr. The error indicates this by showing a memory address that is close to zero, in this case 0x00000018. Of course the memory at this address does not contain the data you want. (if the memory address does not seem close to zero at all, you might be encountering a Garbage Collector Crash)
This could for example occur on the following code (simple example):
APlayerController* PlayerController = GetWorld()->GetFirstPlayerController();
PlayerController->SetViewTarget(this);
In this case, if the result of GetWorld()->GetFirstPlayerController() is nullptr, the SetViewTarget() call on the next line will crash with an access violation.
Moreover, this code could even crash on the first line if the result of GetWorld() was nullptr, because then we would be calling GetFirstPlayerController() on this invalid address.
One way to avoid this is checking for nullptr on anything you get, for example:
APlayerController* PlayerController = GetWorld()->GetFirstPlayerController();
if (PlayerController != nullptr)
    PlayerController->SetViewTarget(this);
This would avoid the crash, but this would also not call SetViewTarget and we wouldn’t know about it without closer inspection.
Often times it is actually good practice to not explicitly check for nullptr in your code, because you want to crash early and often to find the root cause of issues in your games (see Factorio case study). Only do a conditional check for nullptr if your game can function normally even if the object is invalid.
If you want to be sure to notice when something is nullptr before calling any functions use one of the unreal assertions.
For example:
APlayerController* PlayerController = GetWorld()->GetFirstPlayerController();
ensure(PlayerController != nullptr);
PlayerController->SetViewTarget(this);
This code will hit a breakpoint on the ensure if PlayerController is a nullptr in this case. But since you checked for this specifically, you quickly know something went wrong in getting the player controller specifically, instead of for example something going wrong inside the SetViewTarget().
Always fix the root cause of the access violation, don’t add an if check and ignore the problem.
Unresolved External
During compilation an unresolved external linker error might pop up, something that looks like the following:
error LNK2019: unresolved external symbol "__declspec(dllimport) public: static class UClass * __cdecl UUserWidget::StaticClass(void)" (__imp_?StaticClass@UUserWidget@@SAPEAVUClass@@XZ) referenced in function "class UUserWidget * __cdecl NewObject<class UUserWidget>(class UObject *)" (??$NewObject@VUUserWidget@@@@YAPEAVUUserWidget@@PEAVUObject@@@Z)
This error indicates that you are trying to access something that the linker is unable to find the symbols for.
This can be caused by a few different reasons, described below:
Missing dependency
The most common cause of this within unreal is missing a module dependency.
In the case of the example error above, we can see that is complaining about something related to the UUserWidget class. So, we google for the documentation page of this class, where we land on this:
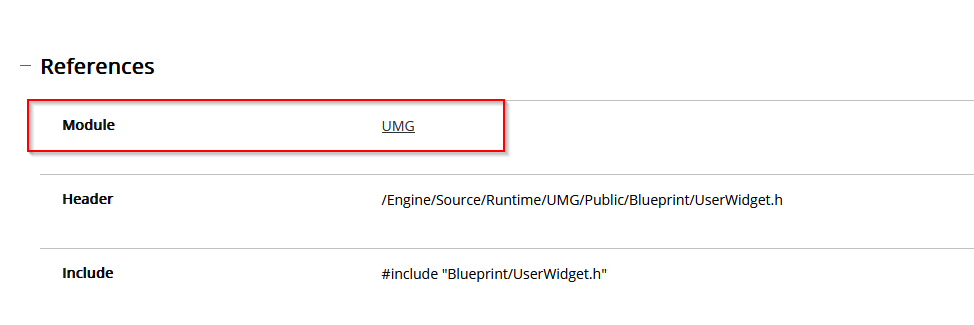
As we can see, the module is mentioned on this page. To include this module in our project, we need to add it to our depencies.
To do this open your <projectname>.Build.cs file (normally found in the project’s Source/<projectname> folder) and add the module as a string to the public or private dependencies, in case of this example we add the "UMG" module at the end:
PublicDependencyModuleNames.AddRange(new string[] { "Core", "CoreUObject", "Engine", "InputCore", "UMG" });
Type is not exported
If this does not fix your issue, it might be that the class you are trying to use is not exported by it’s module. You can check this by looking at its source code, if there is not <MODULE>_API in the class declaration, the class is not exported. Unfortunately there is no easy way to fix this, so maybe try looking for another solution to your problem.
Missing function implementation
A third option that could cause unresolved external errors is declaring a function in your header, but not declaring a function body for it.
For example if you have this on your header:
void Foo();
But it has not implementation in the matching .cpp file, this would cause an error.
To resolve this, simply declare the function body for it in your .cpp:
UMyClass::Foo()
{
    // Code goes here
}
In case of short functions or templated functions, it is also possible to define the function body direcly in your header as follows (although doing implementation in the .cpp is the preferred way of working):
void Foo()
{
    // Code goes here
}
Undefined Type
During compilation of your project you could encounter an error mentioning use of undefined type, e.g.:
error C2027: use of undefined type 'UUserWidget'
What this means is that the compiler has no idea that, UUserWidget in this case, is a type, and what that type would look like.
To do this we need to tell the compiler that this is actually a class that we are dealing with and what it’s memory layout is like before using it.
This can be achieved by simply adding the include for this type on top of you file.
One way to find the correct include file is to google for the documentation page. In this example this page.
What we are looking for here is Include:
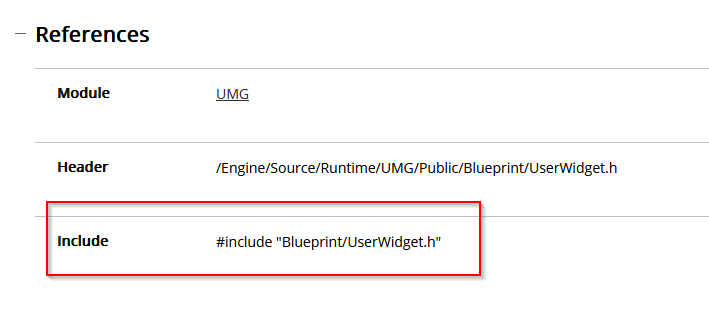
So to resolve the issue in this case, we would add #include "Blueprint/UserWidget.h" to the top of our file and this would resolve our compiler issue.
However, it is important to note that when encountering this issue in header files, forward declaring is a better solution.
With forward declaring, we can avoid circular dependencies and improve compile times.
Note: forward declaration only works if the size of the class does not need to be know, e.g. when using pointers.
So, let’s say we have a UUserWidget* MyWidget property in our header, and are getting an undefined type error, we could forward declare this by adding the following to the top of our class (after includes):
class UUserWidget;
This informs the compiler that UUserWidget is in fact a type, and as long as the size of it or the memory layout does not need to be known, this is enough.
In most cases it suffices to do forward declaration in the header, and then when actualy using the property in your .cpp file, you add the include on top of that file instead of in the header.
Garbage Collector Crash
If you are encountering crashes at seemingly random times, it might be that you are encountering a garbage collection (GC) issue.
Unreal cleans up unused objects every so often, if the object that you were trying to access was deemed unused by the engine, it might have been cleaned up, causing you to crash on the following use of it.
The most common cause of this is forgetting to put UPROPERTY() on your UObject derived properties.
E.g. if you have a member variable as follows:
UCameraComponent* CamComponent;
And you assign to it a component using CreateDefaultSubobject, the garbage collector does not know that you are interested in keeping this object alive. So, on the next GC cycle, it will destroy this object without letting you know, causing CamComponent to become a dangling pointer. The next time you try to access CamComponent you will encounter an access violation, but with a seemingly random memory address (not close to zero).
To fix this issue we simply update the propert in our header as follow:
UPROPERTY()
UCameraComponent* CamComponent;
Now that we marked this UPROPERTY the garbage collector knows that we are using this object and will not automatically clean up.
An alternative to this is using smart pointers. Although be aware that Unreal’s implementation of these is not perfect.
Tick not being called
If you have override the tick function on your actor of component be sure that your ticking is set up correctly.
There’s 2 main things to ensure this, first in your constructor make sure that ticking is actually enabled on your actor as follows:
PrimaryActorTick.bCanEverTick = true;
PrimaryActorTick.bStartWithTickEnabled = true;
Second, if this is done and your actor is still not ticking, it might be that you have overridden the BeginPlay in your class but forgot to call Super::BeginPlay(). Always do this:
void AMyActor::BeginPlay()
{
	Super::BeginPlay();

	// Your code goes her
}
Basic Debugging
If you’re running into a runtime issue that you can’t immediately figure out, like an access violation, it might be in your best interest to start a debugging session. Debugging allows you to place breakpoints, where the code execution will pause when executing that code. At this point you can look at the values for all the local and member variables that are in use at that moment. This is an easy way to see what is nullptr when dealing with an access violation for example.
Before starting to debug, it is very important to put the build configuration to DebugGame Editor. If put on Development Editor, code execution will jump all over the place and variables will be optimized away.
To do this, you first want to place a breakpoint around the suspected problematic code.
Go to the line where you want code execution to pause and click in the sidebar on the left of that code, so that a red dot appears on it.
A shortcut for this is just selecting the line and pressing F9.
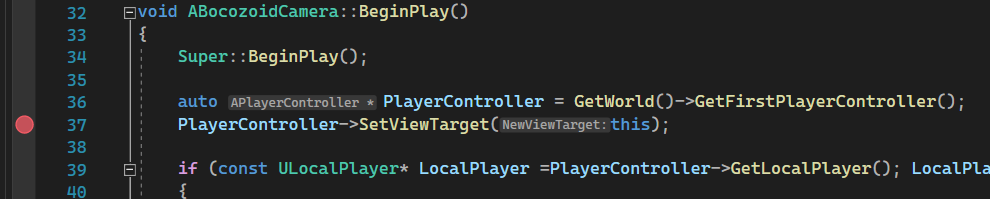
In the image above, the code will stop (a.k.a. break) when hitting the line where we call PlayerController->SetViewTarget().
IMPORTANT: When hitting the breakpoint, this line has not been executed yet. So, if you break on an assignment line, the value will not be set until that line is executed, e.g. by stepping to the next line (F10) or by continuing to run (F5).
To trigger the breakpoint, press F5 (or press “Local Windows Debugger” in the top bar) so that your code is compiled and the editor is launched with Visual Studio attached. You know VS is attached when at the bottom it shows an orange bar (red for VS2022).
Now run your game as you normally would, up to where the code with the breakpoint in would be executed.
NOTE: Close the editor before starting a debugging session.
Now that the breakpoint is hit, you can jump through the code line by line by pressing F10 and see what happens. If you want to step into a function, e.g., see the code of SetViewTarget in this case, you can press F11;
You can inspect the values of variables by either hovering over them, or using the locals or auto tab (which is by default located on the bottom left). You will see the values in here change as you step through the code, this makes it a lot easier to spot potential issues.
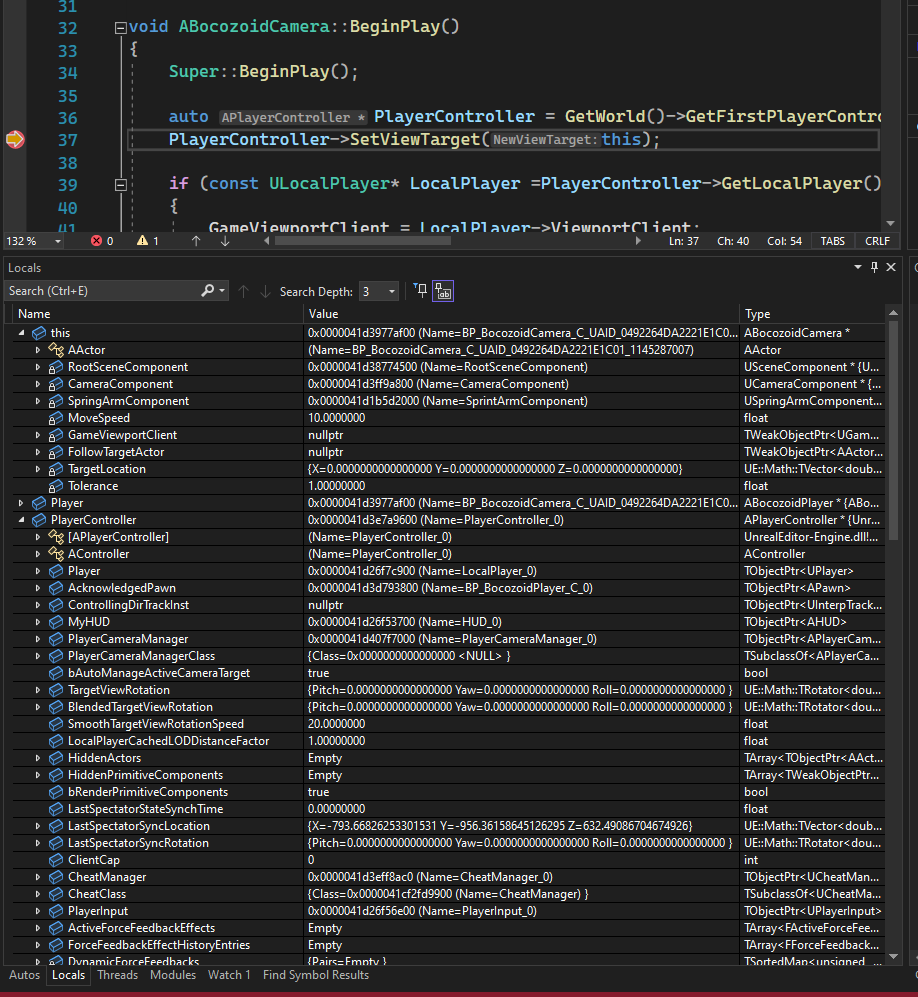
If you want to keep an eye on a specific variable during debugging, you can rightclick on it in code during debugging and click “Add Watch”, this will pin this variable in the watch tab, which can be found in the same section as the Autos and Locals tab.
Also see the Microsoft C++ Debugging Guide
Editor Symbols
If your game is crashing and the callstack is not very informative, containing lots of Unknown and UnrealEditor, for example:
UnrealEditor_UnrealEd
UnrealEditor_UnrealEd
UnrealEditor_CoreUObject
UnrealEditor_UnrealEd
UnrealEditor_UnrealEd
UnrealEditor_UnrealEd
UnrealEditor
UnrealEditor
UnrealEditor
UnrealEditor
UnrealEditor
UnrealEditor
kernel32
ntdll
you are probably missing debug symbols.
Debug symbols allow you to get a correct callstack for engine code, so you can exactly know where things went wrong.
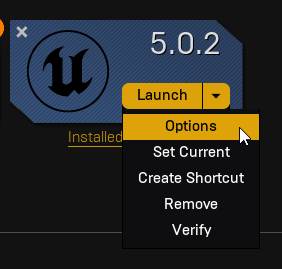
You can install these through the epic games launcher, when modifying your engine install. To do this go to the Options of the engine version you want the symbols for:
In the window that pops up, check the box next to “Editor symbols for debugging” and press apply:
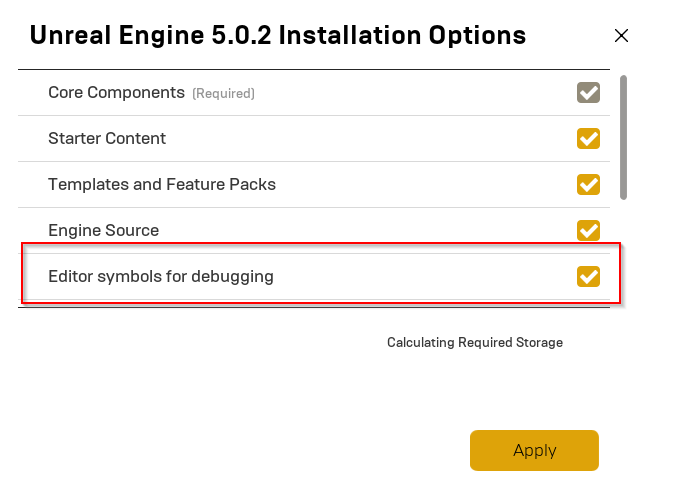
This will start installing debug symbols for UE. Once this is done, rerun your program up to the crash and the callstack will probably be much more informative.
Unity Build
By default, unreal has a feature enabled that is called “unity build”. This has nothing to do with the game engine Unity.
Unity build basically means that unreal packs a bunch of your files together in one compilation unit for improved compile times on large projects. However, for most projects, disabling this is actually faster.
Moreover, if unity build is enabled the compiler might actually hide errors regarding missing includes, since all these files are batched together, if you have an include in one file, they all “contain” it. When the unity build decides to change the batching up a bit this might give seemingly random sudden undefined type errors.
To disable unity build and be sure you always notice missing includes, you just have to set a simple setting in your <projectname>.Build.cs file (normally found in the project’s Source/<projectname> folder):
bUseUnity = false;
Note: For engine versions older than 4.24, this setting is called
bFasterWithoutUnityand should be set totrue.
Alternatively, you can set the following setting in your <projectname>.Target.cs file (normally found in the project’s Source folder):
bUseUnityBuild = false;
However, this second approach is not recommended for use with a source build of the engine, using the .Build.cs approach is always safe.